Accountability Dashboard
Listening, learning and reporting back to our community.
Accountability Dashboard
This accountability dashboard is a voluntary transparency tool that provides quarterly updates on our engagement with the community. Biannual updates related to financial and contracting metrics can be found under the reporting tab.
Listening
Community Presentations and Events
4
January - March 2026
There were 4 community presentations and events that resulted in 193 engagements! Community presentations and events include presentations at regional conferences, advisory group meetings, neighborhood association meetings, community tabling and other community events.
Comments Received
337
January - March 2026
Office Hours Visitors
4
January - March 2026
In-person and virtual office hours were available to allow community members to meet with the Program team to ask questions and share their feedback. From January - March 2026, we had 4 community members attend.
Social Media Engagements
21,403
January - March 2026
Newsletter Subscribers
7,114
Subscribers to date
Media Stories
194
January - March 2026
Media stories generated about the IBR Program between January and March 2026.
Videos Produced
3
January - March 2026
Social video and longer-form content focused on highlighting what the Program accomplished in the prior year, how the Program is progressing, and reinforcing why the aging bridge needs to be replaced.
Top-performing content was short, engaging, and designed specifically for social platforms, with a strong emphasis on educating audiences and making complex information accessible.
YouTube Lifetime Views
95,000+
Since program launch
Lifetime YouTube Views are all of the views from the IBR Program channel since the Program started uploading videos.
Website Visitors
13,791
January - March 2026
An anonymous website metric which tracks users visiting a website. This metric includes new users and returning visitors, but does not include the numbers of pages viewed which is substantially higher.
Learning
The IBR Program rolled out an updated cost estimate on March 17. Details of the updated estimate were published in a news release and provided in a public presentation to members of the Program's Executive Steering Group. The announcement included an outline of a core set of projects that will be advanced with available funding. These core projects include fixed-span replacement bridges across the Columbia River, connections to Interstate 5, extending light rail to Vancouver, and removal of the existing structure.
Oregon Gov. Tina Kotek and Washington Gov. Bob Ferguson underscored their respective states’ commitment to building a more efficient and earthquake-resilient Interstate 5 bridge across the Columbia River in a joint statement released by their offices.
Both states remain committed to constructing the full five-mile corridor over time. Each phase of work must meet federal requirements by operating effectively and delivering benefits to the traveling public independent of future phases. This first phase will significantly improve earthquake resilience, enhance roadway safety, support more predictable travel for people and freight, and expand transit and active transportation options.
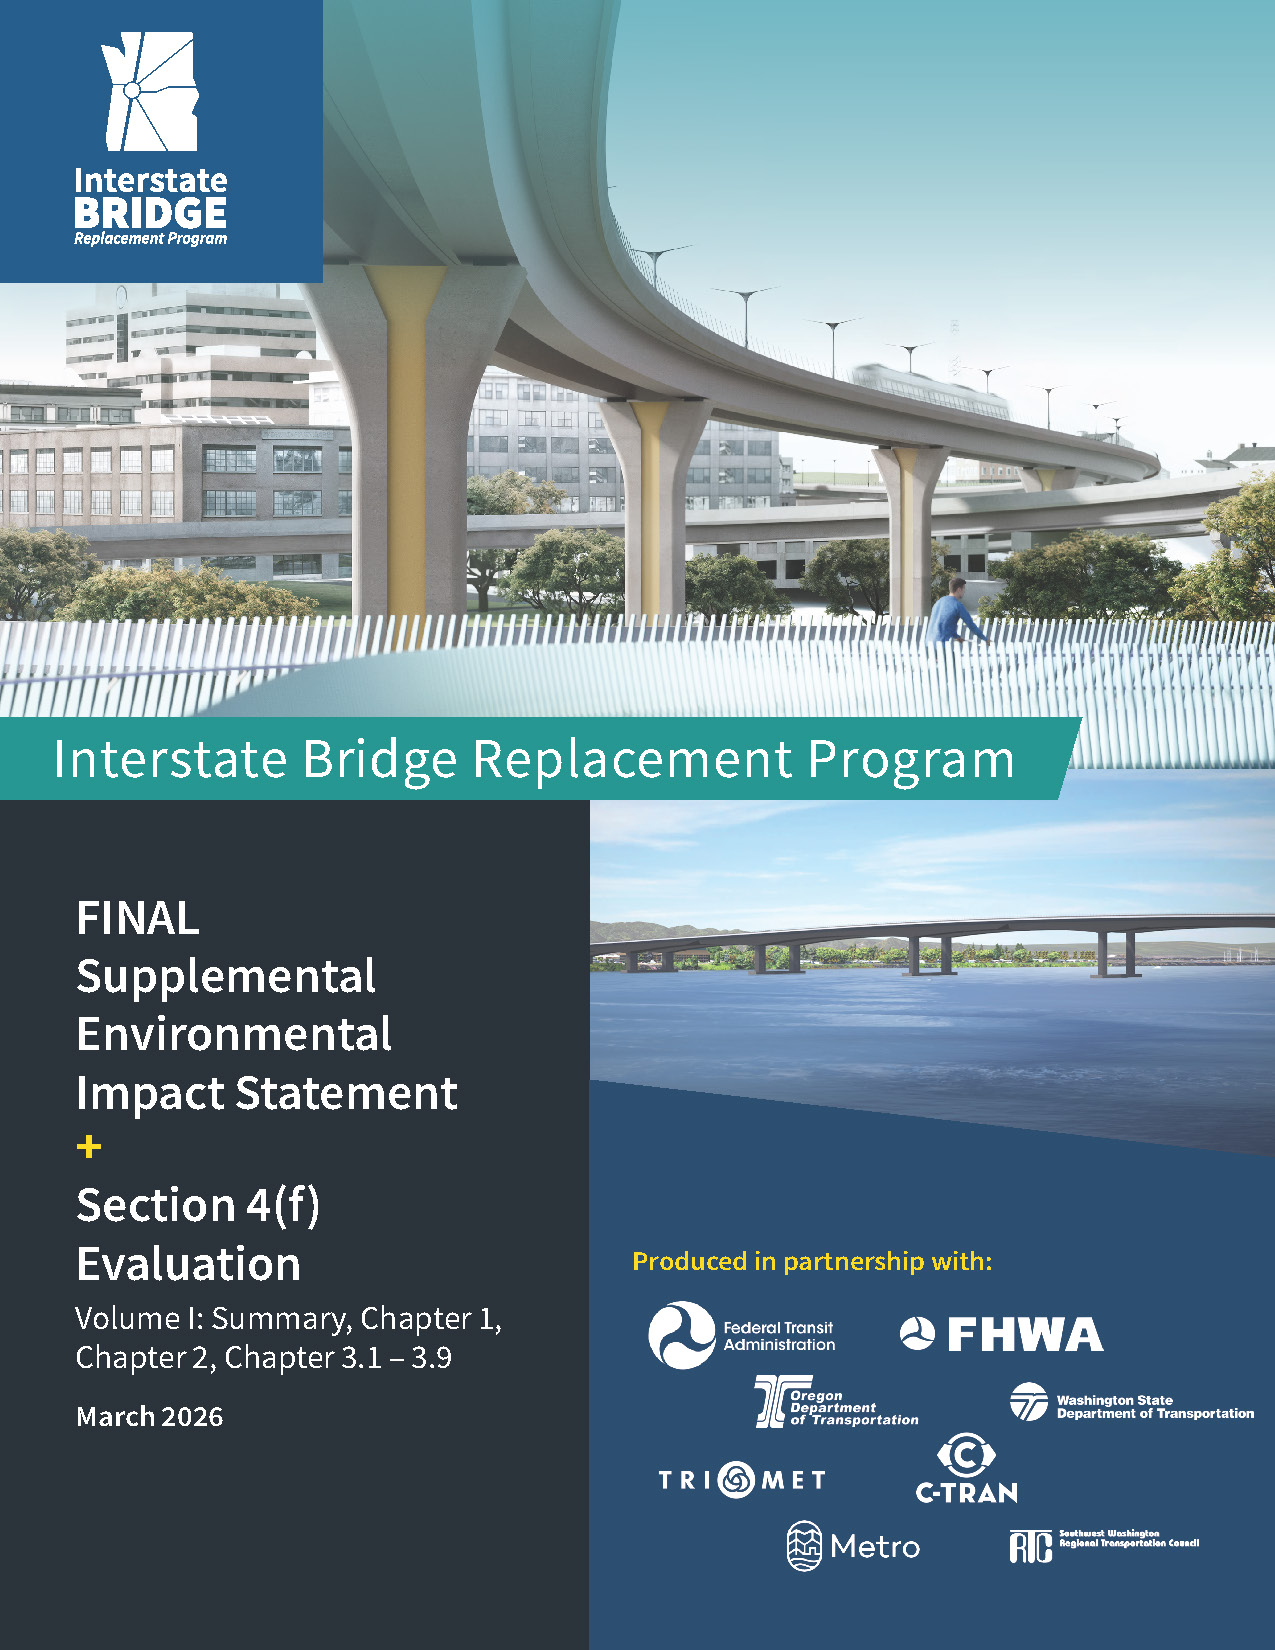
Nearing completion of federal environmental review process
On April 17, The Final Supplemental Environmental Impact Statement (SEIS) was published, which reflects years of technical analysis, coordination with partners and input from thousands of community members. This work has helped the Program better understand potential impacts and make refinements.
In the coming months, the Federal Highway Administration and Federal Transit Administration are expected to issue an Amended Record of Decision, allowing the Program to enter construction. The Final SEIS includes key updates such as recommended design options, responses to more than 9,100 public comments, updated program footprint, and commitments to avoid, minimize and mitigate impacts.
This information provides the foundation for the Program to move into construction with a clearer picture of the impacts and benefits of building a safer, more reliable, and more resilient crossing that meets the region’s long-term needs.
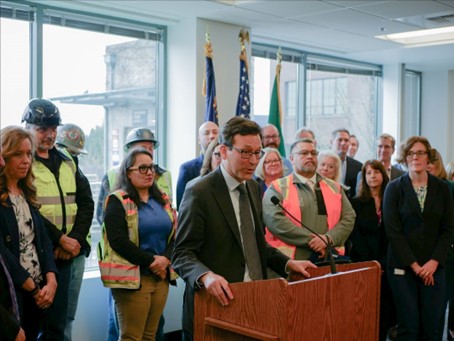
Executive Steering Group Highlights
Executive Steering Group members received a presentation on the updated 2026 cost estimate and the identification of a core set of projects to initiate construction of the full five-mile Program corridor. The meeting also included partner updates and an opportunity for public comment. The session concluded with a discussion of next steps as the Program advances toward construction.
YouTube Views
300
March 2026
YouTube views are those who viewed the Executive Steering Group meeting from YouTube either during the presentation or at a later time/date.
| Group | YouTube Views |
|---|---|
| Executive Steering Group | 300 |
What we've heard and how we're responding
Will light rail and shared-use facilities be removed from the IBR Program’s list of construction projects to cut down costs?
Businesses of all sizes are interested in how they can learn about future opportunities to work with the IBR Program as construction draws closer.
The public is curious about what implications construction will have on local and highway traffic once work on a replacement bridge begins.
Reporting
Updated through December 2025*
Contracting and expenditure data is updated two times a year. The data takes longer to receive and compile and may not be available until after the reported timeframe. The Program will continue to share accountability reports and develop additional reporting metrics. The most recent updated finance reports provide information about the economic impact analysis, finance planning and risk assessment efforts completed for components included in the Modified Locally Preferred Alternative which were approved for further analysis in July 2022. Cost estimates and financial plans will continue to be updated as the Program is refined.
Current reports are listed below. For more information, visit our library.
Financial Reports
Economic Impact of IBR Program Capital Investment (April 2023)
IBR Financial Plan (April 2023)
Quantitative Risk Assessment Summary (April 2023)
Quantitative Risk Assessment Report (April 2023)
Bi-state and Legislative Reports
2022 Legislative Progress Report (December)
2022 Legislative Progress Report (June)
DBE Program Status and Data Currency Important Program Status Notice**
As of October 3, 2025, the U.S. Department of Transportation (USDOT) published an Interim Final Rule (IFR) affecting the Disadvantaged Business Enterprise (DBE) and Airport Concessions DBE (ACDBE) programs under 49 C.F.R. Parts 23 and 26. Under this IFR, DBE contract goals, counting of DBE participation toward project and overall program goals, and related compliance activities are temporarily suspended pending reevaluation of all currently certified firms under the new individualized certification criteria. During this interim period, recipients of USDOT financial assistance may not set new DBE goals nor count DBE participation toward federal contract goals until the reevaluation process is complete.
The data presented in this dashboard reflect utilization and diversity information through September 18, 2025, and do not include DBE goal attainment or counting of DBE participation following the USDOT IFR effective October 3, 2025. This dashboard is provided for informational purposes and does not imply active goal achievement under the DBE program during the interim IFR period.
For more information about the IFR and its implementation, including USDOT’s official rule text and guidance, please visit the U.S. Department of Transportation’s IFR page:
Small Business Participation Goals
Through September 18, 2025**
Percent of contracts awarded to small businesses through September 18, 2025**.
Small Business Contract Values
Through September 18, 2025**
Awarded contract amounts to small businesses to date through September 18, 2025**.
| Asian-Pacific American | $16,498,162 |
| Black American | $13,690,403 |
| Caucasian | $11,962,499 |
| Hispanic American | $955,571 |
| Native American | $1,771,416 |
| Subcontinent Asian American | $894,585 |
Current Funding Sources
* The 2023 IBR financial plan identifies a mix of funding sources needed to complete construction, including state contributions ($1B from each state), tolling (approximately $1.24 billion) and federal grants (approximately $2.5B)
Committed Funding
Oregon
- $55,000,000 – CFDA 20.205, title Highway Planning and Construction, Federal Aid Highway Program Funds
- $1,000,000,000 - Committed through HB 5005 (2023). $250,000,000 authorized for bonding in 2023-25 biennium.
Washington
- $45,000,000 – WA State Motor Vehicle account funds.
- $117,700,000 – Committed through Connecting Washington transportation package for Mill Plain Interchange improvements, which are within the IBR Program area. Original commitment of $97,000,000 increased to $117,700,000 in 2023 legislative session to reflect inflation to future year of expenditure dollars.
- $1,000,000,000 - Committed through the Move Ahead WA transportation package. $137,500,000 allocated for 2023-25 biennium.
Federal Grants
- $600,000,000 - U.S. Department of Transportation Mega Program funding announced.
- $1,500,000,000- Bridge Investment Program
- $1,499,000,000 Construction grant announced in July 2024
- $1,000,000 Planning grant announced in October 2022
Current Expenditures
Through December 2025*
| IBR Program Work | Spent through December 2025* |
| WSDOT | $ 14,235,189 |
| ODOT | $ 19,777,295 |
| General Engineering Consultant** | $ 228,881,366 |
| Intergovernmental Agreements | $ 17,277,267 |
*Spending reflects all costs associated with Program work since efforts were reinitiated in July 2019, including labor, equipment, and expenses. Oregon and Washington states have agreed to share costs equally, but the timing of funding and expenditures will vary.
**General Engineering Consultant figure reflects costs incurred for work performed through the date indicated.
GEC Expenditures
Through December 2025*
|
Amount |
Expenditure through December 2025 |
|
27,612,534.34 |
GEC Exp-Program Management |
|
21,891,267.87 |
GEC Exp-Program Controls |
|
7,148,031.80 |
GEC Exp-Financial Structures |
|
10,125,274.83 |
GEC Exp-Communications |
|
8,507,073.39 |
GEC Exp-Transportation Planning |
|
32,172,283.33 |
GEC Exp-Environmental |
|
17,584,109.07 |
GEC Exp-Transit Planning/Engineering |
|
30,594,848.13 |
GEC Exp-Design Engineering |
|
17,870,052.77 |
GEC Exp-Major Structures |
|
16,784,533.09 |
GEC PUBLIC AFFAIRS (PA) & GOVERNMENT RELATIONS |
|
4,405,365.68 |
GEC PRE-PROCUREMENT & PROCUREMENT SUPPORT |
|
4,829,691.96 |
GEC INTEGRATED TECHNOLOGY |
|
971,494.89 |
GEC CLIMATE |
|
5,420,497.81 |
GEC DIVERSITY, EQUITY, AND INCLUSION |
|
382,162.07 |
GEC SAFETY |
|
1,405,715.42 |
GEC QUALITY & DOCUMENT CONTROL |
|
5,448,239.39 |
GEC 3rd PARTY AGREEMENTS |
|
2,903,419.81 |
GEC CRB PROCUREMENT |
|
1,410,516.48 |
GEC Pre-completion Tolling |
|
3,629,395.19 |
GEC ROW |
|
7,784,859.31 |
GEC Exp-Direct Expense |
Consultant Representation by Geographic Area
Through December 2025*
PNW firms are firms with offices in OR and WA, that are not in the Portland/Vancouver region.
Portland / Vancouver - 42%
Northwest - 21%
Other - 37%
Program Timeline
The Program is utilizing past work as appropriate to maximize past investment and support efficient decision-making, while also taking into account changes that have occurred since the previous planning process to identify a solution that meets current and future community needs and priorities. The IBR Program will work with the community, as well as local, state, federal and tribal partners to complete the following work in the coming years:
- Complete the environmental review process
- Obtain state and federal permits
- Finalize program design
- Develop a finance plan
- Secure adequate funding
- Complete right-of-way acquisition
- Advertise for construction
The following chart provides an overview of the target timeline goals for the general buckets of work that need to be completed to begin construction. Community and stakeholder engagement will continue through construction.
| Category | Start Date | End Date |
|---|---|---|
| Program Launch | Fall 2020 | Winter 2021 |
| Planning | Fall 2020 | Winter 2022 |
| Environmental | Summer 2021 | Early 2026 |
| Design | Winter 2021 | 2027 |
| Permitting | Summer 2025 | 2027 |
| Pre-Construction | Summer 2025 | 2027 |
| Community Engagement | Fall 2020 | Ongoing |
Previous Accountability Dashboards
Accountability Dashboard V.19 October - December 2025
Accountability Dashboard V.18 July - September 2025
Accountability Dashboard V.17 April - June 2025
Accountability Dashboard V.16 January - March 2025
Accountability Dashboard V.15 October - December 2024
Accountability Dashboard V.14 July - September 2024
Accountability Dashboard V.13 April - June 2024
Accountability Dashboard V.12 January - March 2024
Accountability Dashboard V.11 October -December 2023
Accountability Dashboard V.10 July - September 2023
Accountability Dashboard V.9 April - June 2023
Accountability Dashboard V.8 January - March 2023
Accountability Dashboard V.7 October - December 2022
Accountability Dashboard V.6 July - September 2022
Accountability Dashboard V.5 April - June 2022
Accountability Dashboard V.4 January - March 2022
Accountability Dashboard V.3 September - December 2021
Accountability Dashboard V.2 June - August 2021
Accountability Dashboard V.1 January - May 2021
Number of comments received via email, the website form and public comments from presentations held by the Community Engagement team.